Data-Driven Predictions of Glycemic Extremes Using Machine Learning


Project Title: Data-Driven Predictions of Glycemic Extremes Using Machine Learning
CS_7_MAL Course: Machine Learning
This course was taught by Enrico Grisan (Senior Member, IEEE). He received the M.Sc. degree in electrical engineering from the University of Padua, Italy, in 2000, and the joint Ph.D. degree in bioengineering from the University of Padua and City University, London, U.K., in 2004, defending a thesis on automatic analysis of retinal images. In 2005, he was an Intern with Siemens Corporate Research, Princeton, NJ, USA, and then a Postdoctoral Fellow with the University of Padua, where he has been an Assistant Professor of biomedical engineering, since 2008. In 2019, he joined London South Bank University, as an Associate Professor of artificial intelligence. His current research interests include the understanding of medical imaged and identification of relevant biomarkers from medical data, either through classical image processing and analysis or through machine learning, with applications to neuroimaging, confocal microscopy and microendoscopy, and ultrasound. He has been a member of the IEEE Technical Committee in Biomedical Imaging and Image Processing, since 2015. He has served as the General Chair for IEEE ISBI 2019. He was an Associate Editor of IEEE ISBI and IEEE EMBC conferences.
Overview
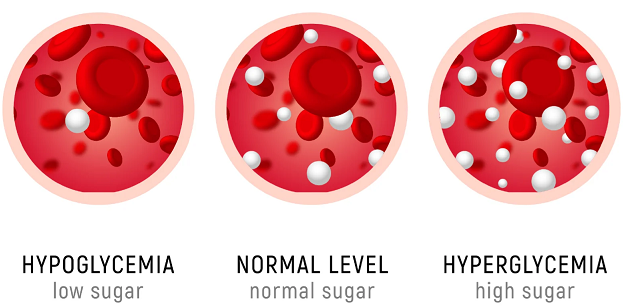
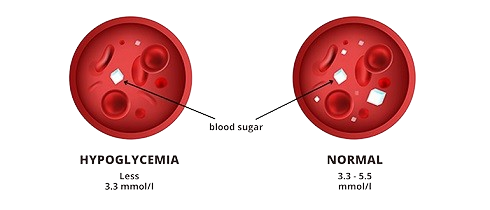
Diabetes is a chronic condition characterized by persistent hyperglycemia (high blood sugar levels) that can lead to complications such as hyperglycemia or hypoglycemia. Both conditions pose a severe threat to the well-being of diabetes patients if not properly monitored. The goal of this project was to utilize machine learning to predict occurrences of these glycemic extremes within the next two hours. Using continuous glucose monitoring (CGM), carbohydrate intake, and insulin dosage data, we trained several machine learning models to accurately predict a patient’s predisposition to hyper- or hypoglycemia in the short term, thereby enabling proactive interventions.
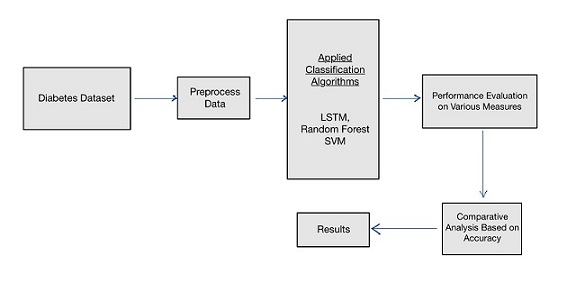
Our solution leveraged three machine learning models—Long Short-Term Memory (LSTM) networks, Random Forest (RF) Classifier, and Support Vector Machines (SVM). Among these, LSTM and Random Forest showed the best performance, with accuracies of 94.7% and 96.3%, respectively. This system aims to offer a predictive approach for managing diabetes, ultimately aiding in lifestyle adjustments and timely medical interventions to mitigate health risks.
Problem Statement
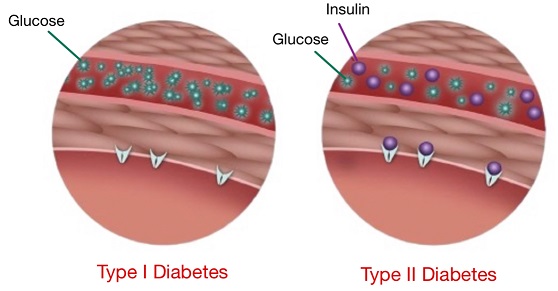
Diabetes, if unmanaged, can lead to critical health issues including hypoglycemia (low blood sugar) and hyperglycemia (high blood sugar). Both conditions can trigger acute complications, affecting vital organs such as the heart, kidneys, and nervous system, and significantly increasing morbidity and mortality risks. Current diabetes management techniques, such as the use of Continuous Glucose Monitoring (CGM) systems, are highly effective for tracking real-time blood glucose levels, yet there is a pressing need for systems that can not only monitor but predict glycemic abnormalities to prevent episodes before they occur. Effective prediction can help reduce emergency situations, improve patient quality of life, and optimize clinical decision-making.
Research Objective
The primary objective of this research was to design a machine learning system capable of anticipating hyperglycemic or hypoglycemic events based on historical data from glucose sensors, insulin intake, and carbohydrate consumption. By predicting these events two hours in advance, the proposed system aims to provide timely alerts to patients and healthcare providers, allowing them to take preventive actions and make informed decisions about insulin administration, dietary adjustments, and physical activity. This approach is intended to significantly enhance diabetes management by minimizing the occurrence of dangerous glycemic episodes.
Dataset and Data Preparation
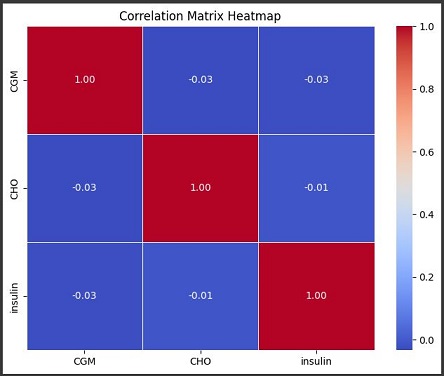
The dataset used for this project was synthetically generated using the FDA-approved UVA-Padova Type 1 Diabetes Simulator, which is a well-established tool for simulating realistic diabetes data. The dataset featured data from 22 subjects of different age groups: children, adolescents, and adults. Each subject’s dataset captured information such as CGM readings, carbohydrate intake (CHO), and insulin dosages, with sampling conducted every 5 minutes, resulting in 288 samples per day for each subject. The data encompassed a variety of daily routines, dietary habits, and insulin administration protocols, providing a comprehensive foundation for training predictive models.
Data Preprocessing and Feature Engineering
We classified our data into three folders (child, adolescent, adult) based on the age group of the subjects. The data was concatenated into a single time series file for each age group to create a more robust and representative dataset. Feature engineering was a crucial step in ensuring that the models could effectively learn from the data. The following feature engineering techniques were applied:
- Lag Features: Lag features were created for CGM, CHO, and insulin intake to capture the temporal dependencies and historical trends in the data. These features represent past values of the variables, allowing the model to identify temporal patterns that could indicate an impending hyperglycemic or hypoglycemic event.
- Rolling Mean: Rolling mean features were computed for CGM, CHO, and insulin intake over various window sizes (e.g., 3, 5, and 10 time steps) to smooth the data and highlight underlying trends. This technique helps to reduce noise and makes it easier for the models to detect consistent patterns over time.
- Interaction Features: Interaction features were created by calculating the product of CGM and insulin levels. These features capture the synergistic effects between glucose levels and insulin administration, which are critical for understanding the dynamics of blood sugar regulation.
- Future CHO Intake Features: Future carbohydrate intake was included as a feature by calculating the sum of CHO intake over a future window of 2 hours (24 samples). This feature provides information about planned dietary intake, which is a significant factor in predicting future blood glucose levels.
- Combined Features for Past Observations: We integrated information from subsets of past observations of CGM, CHO, and insulin to create a holistic representation of historical patterns. These combined features allow the model to consider both short-term and long-term dependencies, which are important for accurate predictions.
Machine Learning Models
The models used for this project were chosen based on their suitability for time series forecasting, classification tasks, and their ability to handle complex dependencies in the data:
- Long Short-Term Memory (LSTM)
- LSTM was selected for its ability to capture long-term temporal dependencies within the data. LSTMs are a type of Recurrent Neural Network (RNN) that can effectively learn from sequential data, making them well-suited for time series analysis. We trained the LSTM model to learn the patterns of blood glucose fluctuations over time, using sequences of 10 previous time points (equivalent to 50 minutes) as input to predict glycemic states. The architecture of the LSTM model included multiple layers with forget gates, input gates, and output gates to overcome the vanishing gradient problem commonly encountered in RNNs. Dropout regularization was applied to reduce overfitting.
2. Random Forest (RF) Classifier
Random Forest was chosen due to its robustness and ability to handle high-dimensional datasets. RF is an ensemble learning method that constructs multiple decision trees during training and aggregates their outputs to make a final prediction. It delivered superior accuracy across datasets from all age groups, but it exhibited a risk of overfitting due to its complex structure and the large number of trees used. Hyperparameter tuning was performed using grid search to optimize the number of estimators, maximum depth, and other parameters to balance the model’s complexity and generalization capability.
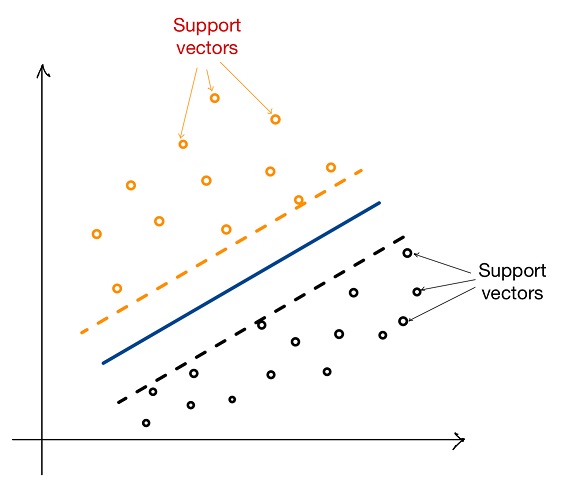
3. Support Vector Machines (SVM)
- SVM was included as a baseline comparison to understand how a simpler model would perform on this complex task. SVM works by finding the optimal hyperplane that separates classes in a high-dimensional space. Although SVM offered decent results for binary classifications, it struggled with the complex temporal relationships in our multi-class dataset, leading to comparatively lower accuracy and higher rates of misclassification. We used a radial basis function (RBF) kernel to allow the model to capture non-linear relationships.
Mathematical and Analytical Insights
In the course of this project, several mathematical and analytical methodologies were applied to enhance model performance and better understand the relationships within the data. The following highlights some of the key mathematical approaches used:
- Target Definition for Classification:
We defined specific conditions for hypoglycemia and hyperglycemia based on the Continuous Glucose Monitoring (CGM) values. A new target column named ‘Target’ was created and initialized to represent normal conditions. The target values were assigned as follows:
- Hypoglycemia (Target = 0): CGM value < 70 mg/dL.
- Normal (Target = 1): CGM value between 70-180 mg/dL.
- Hyperglycemia (Target = 2): CGM value > 180 mg/dL.
These target values were determined based on shifting the CGM readings by 24 samples (equivalent to 2 hours), enabling prediction of future glycemic states.
2. Mathematical Formulas for Model Evaluation:
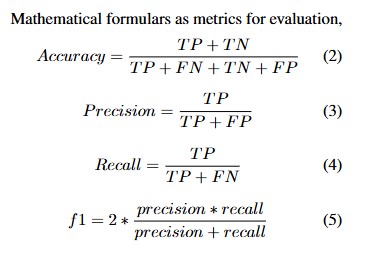
Several metrics were used to evaluate model performance, each defined by the following formulas:
- Accuracy: Where TP represents true positives, TN true negatives, FP false positives, and FN false negatives.
- Precision: Precision measures the proportion of true positive predictions among all positive predictions.
- Recall: Recall measures the ability of the model to identify all relevant positive cases.
- F1-Score: The F1-score provides a harmonic mean of precision and recall, offering a balance between the two.
3. Feature Engineering and Statistical Analysis:
- Rolling Mean Calculation: Rolling means were calculated to smooth noisy CGM, CHO, and insulin intake values over specified window sizes. The rolling mean is computed as:
Where is the window size and represents the data point at time step .
- Interaction Features: Interaction features were calculated to capture nonlinear relationships between variables, such as the product of CGM and insulin levels. This is represented as:
4. Hyperparameter Tuning for Random Forest:
Hyperparameter optimization was conducted using a grid search approach, aiming to identify the ideal values for parameters such as:
- Number of Estimators (n_estimators): The number of trees in the forest.
- Maximum Depth (max_depth): The maximum depth of each tree to control overfitting.
The parameter values were chosen based on cross-validation results to ensure optimal model performance.
Results
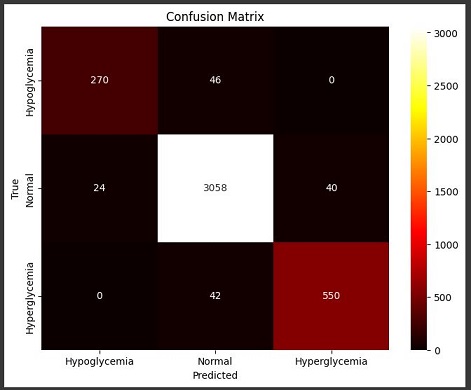
The evaluation metrics for the models were accuracy, precision, recall, and F1-score, focusing on three classes: hypoglycemia, normal, and hyperglycemia. These metrics provided a comprehensive assessment of each model’s performance, particularly in terms of correctly identifying critical glycemic events that require immediate attention.
- Random Forest Classifier: The Random Forest classifier outperformed the other models, with an average accuracy of 96.3%. It also demonstrated high precision and recall across all three classes, indicating that it was able to accurately detect both hyperglycemic and hypoglycemic events without generating many false alarms. The ensemble nature of Random Forest contributed to its robustness, as it effectively reduced variance and prevented overfitting by averaging the predictions of multiple trees.
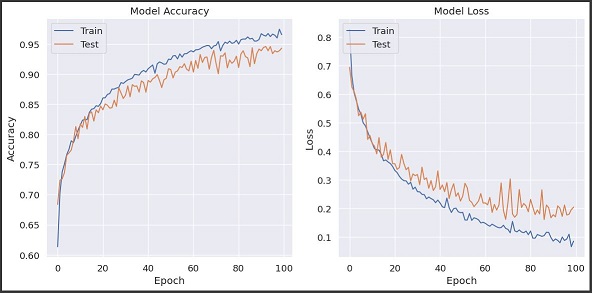
- LSTM Model: The LSTM model achieved an accuracy of 94.7%, demonstrating a strong ability to capture temporal glucose trends. LSTM’s recurrent structure enabled it to learn complex dependencies in the time series data, but it was slightly less consistent compared to RF, especially in distinguishing between hypoglycemia and normal conditions. The LSTM’s performance could be further improved by increasing the dataset size and employing more sophisticated hyperparameter optimization techniques.
- SVM Model: The SVM model achieved an accuracy of 79%, which was considerably lower compared to the other models. It struggled with identifying subtle variations in glycemic levels, leading to more false positives and false negatives. The relatively poor performance of SVM highlights the importance of using models that can capture temporal dynamics, as static classifiers like SVM are limited in their ability to learn from sequential data.
Detailed Performance Metrics Overview:
- Random Forest Classifier:
- Accuracy: 96.3%
- Precision: High precision across all three classes, indicating a low false positive rate.
- Recall: High recall, particularly for hypoglycemic and hyperglycemic events, ensuring that critical conditions were not missed.
- F1-Score: Balanced F1-scores, reflecting the model’s effectiveness in both precision and recall.
- LSTM Model:
- Accuracy: 94.7%
- Precision and Recall: Strong precision and recall for predicting normal and hyperglycemic states, but slightly lower for hypoglycemia due to the overlapping features between classes.
- F1-Score: The F1-score was generally high, but there was room for improvement in distinguishing hypoglycemia from normal conditions.
- SVM Model:
- Accuracy: 79%
- Precision and Recall: Lower precision and recall, particularly for the hypoglycemic class, resulting in higher rates of misclassification.
- F1-Score: The F1-score was significantly lower compared to RF and LSTM, emphasizing the limitations of SVM in this context.
Conclusions and Future Work
Our research demonstrated the viability of using machine learning to predict glycemic events in diabetes patients. The Random Forest classifier showed great promise for this application due to its high accuracy and ability to generalize across different age groups. However, its tendency towards overfitting suggests that further refinement, such as incorporating feature selection methods or reducing the model’s complexity, may be necessary to ensure consistent performance in real-world settings. The LSTM model’s ability to learn temporal patterns was also encouraging, and future iterations could benefit from larger datasets and advanced hyperparameter tuning to further improve accuracy and reduce overfitting.
Future work will focus on incorporating real-world patient data to validate the model’s performance in clinical settings. Additionally, integrating other physiological indicators, such as heart rate, physical activity, and sleep patterns, could provide a more holistic view of the factors influencing blood glucose levels. We also plan to optimize model architectures by exploring attention mechanisms in LSTM networks to improve their ability to focus on the most relevant parts of the time series data. Finally, expanding the system’s capabilities to provide personalized recommendations based on predictions could significantly enhance its practical utility, enabling patients to receive tailored advice on insulin administration, dietary adjustments, and lifestyle modifications.
Contributors
Below are the contributors to this project, including their names and pictures:
- Adeoluwa Oyinlola
- Glory Ndumbuchi Kekeocha
- Hamid Hussain
- Chuku Lydia Chinasa
- Shayan Mudassar
Github Link: https://github.com/Adeoluwa2/Hypoglycaemia-Hyperglycaemia-Detection/blob/main/Machine_Learning_CW_Group3.ipynb
Contributors


Lecturer