Hydrogen Spectral Analysis


Hydrogen Spectral Analysis
Lecturer: Dr. Ali Salimian
This project was undertaken as part of my MSc coursework under the expert guidance of Dr. Ali Salimian. His mentorship provided a solid foundation in understanding hydrogen spectral analysis, emphasizing both theoretical insights and practical applications.
Goal
The primary goal of this project was twofold:
- Predicting Hydrogen Concentration: Using deep learning techniques, we aimed to develop a regression model capable of accurately estimating the concentration of hydrogen in various samples.
- Classifying Samples Containing Hydrogen: Through advanced classification techniques, we sought to determine whether a sample contained hydrogen, based on its spectral data.
The project also emphasized data visualization and exploratory data analysis (EDA) to better understand the dataset before delving into predictive modeling.
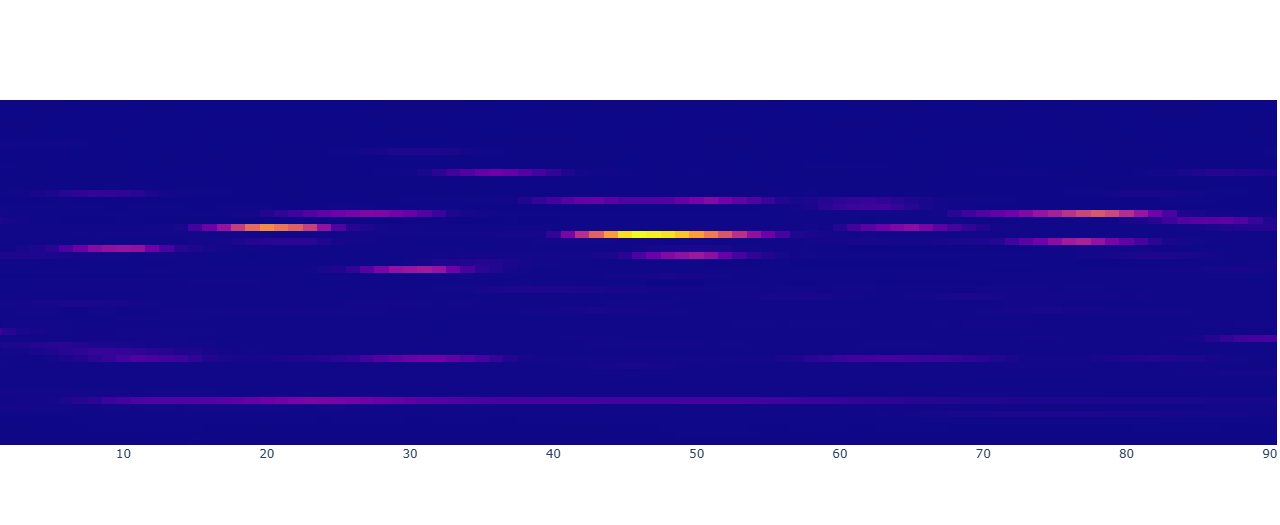
Introduction
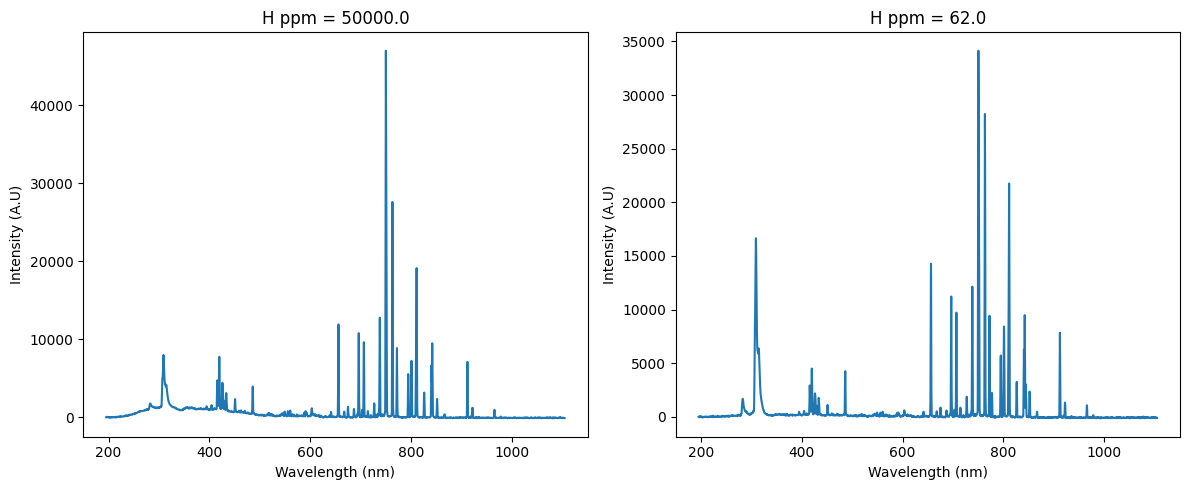
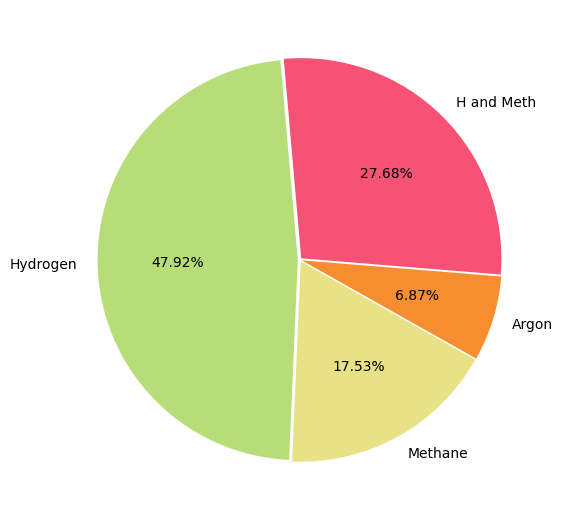
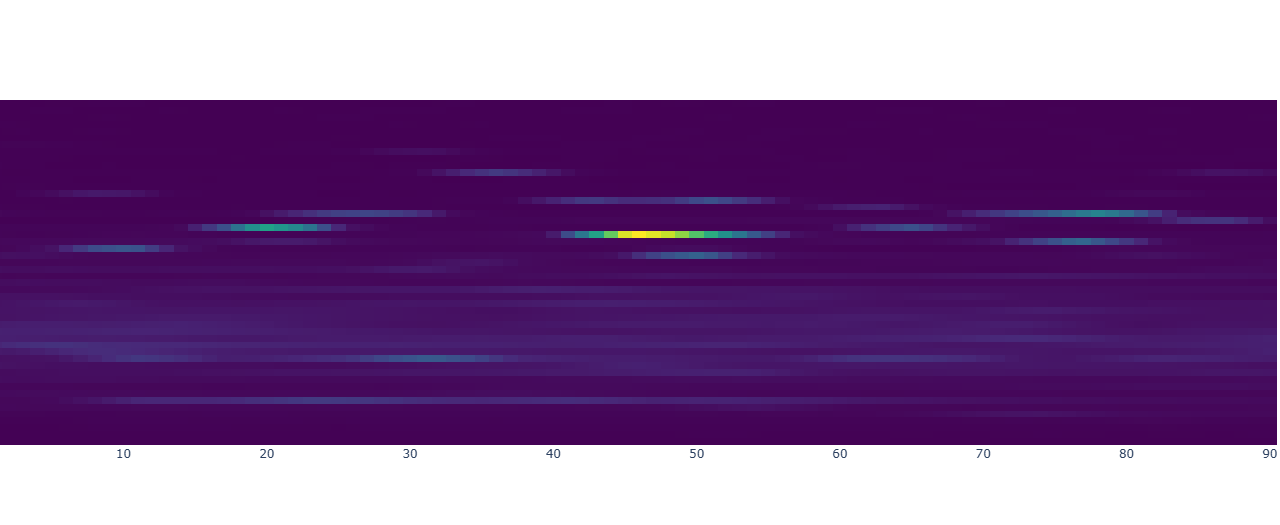
Hydrogen plays a vital role in various scientific and industrial applications, making its accurate detection and quantification critical. In this project, we worked with a dataset containing spectral information for gases, including hydrogen, methane, and argon. The challenge was to process this raw dataset, derive meaningful insights through visualization, and ultimately use deep learning to predict hydrogen concentration and classify samples. This journey was not only a technical endeavor but also an opportunity to explore the intersection of data science and scientific research.
Data Understanding and Preprocessing
Our first step involved loading the dataset, which was stored on Google Drive, into a collaborative environment using Google Colab. The dataset contained multiple variables, including the flow rates of hydrogen, methane, and argon, along with other features.
To begin, we explored the dataset to understand its structure. Using tools like Pandas, we examined the first few rows, checked the dataset’s dimensions, and analyzed the types of variables present. We quickly noticed some inconsistencies, such as missing values in the Meth_flow column, which required attention. Cleaning the data was a meticulous process, involving:
- Dropping irrelevant columns, such as unique IDs, that did not contribute to the analysis.
- Filtering the dataset to focus specifically on hydrogen, methane, and argon, as these were the primary gases of interest.
- Resolving missing values through imputation, ensuring the dataset remained robust without losing significant information.
Another important task was standardizing the dataset. Standardization helped ensure that variables were on the same scale, a crucial step for the performance of machine learning models. By the end of this stage, we had transformed a raw, unstructured dataset into a clean, analyzable format.
Exploratory Data Analysis (EDA)
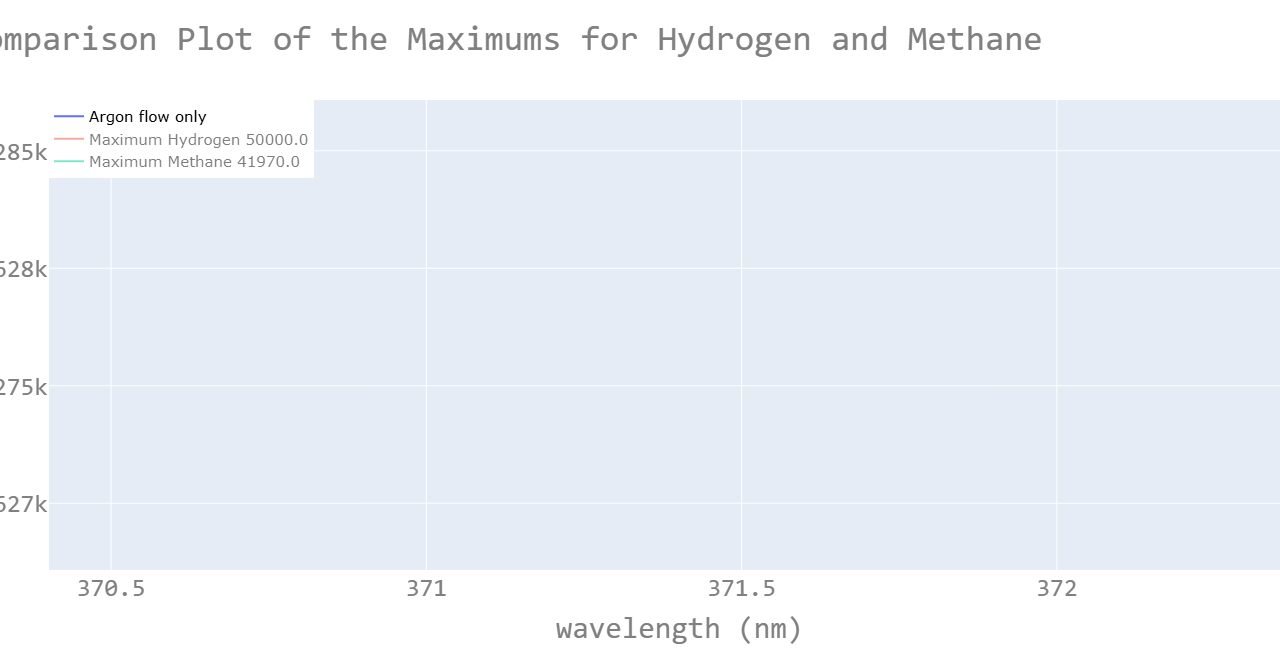
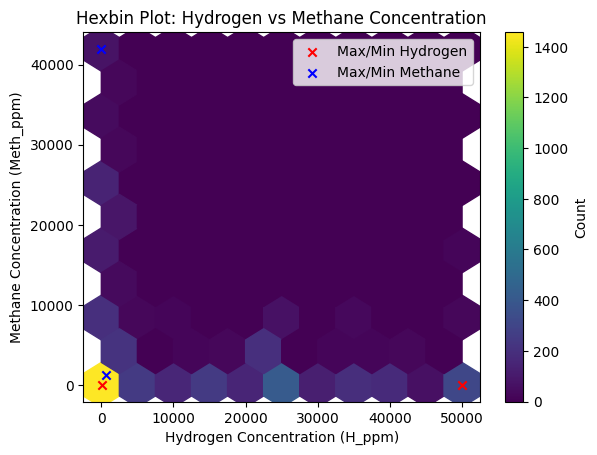
With a refined dataset, we delved into exploratory data analysis to uncover patterns, relationships, and trends. Visualization was at the heart of this process. Using Matplotlib and Seaborn, we created a variety of plots to make sense of the data:
- Histograms provided a view of the distribution of gas flow rates, revealing any skewness or irregularities.
- Scatter plots highlighted relationships between variables, such as how methane flow correlated with hydrogen concentration.
- Box plots helped identify and address outliers that could potentially skew our analysis.
One particularly insightful visualization was a correlation heatmap. This heatmap quantified relationships between variables, showing, for example, that hydrogen concentration was strongly correlated with certain other features. These findings were not just academic; they informed the feature selection process, guiding us on which variables to prioritize when building predictive models.
Deep Learning for Prediction and Classification
The predictive aspect of this project was divided into two tasks: regression and classification.
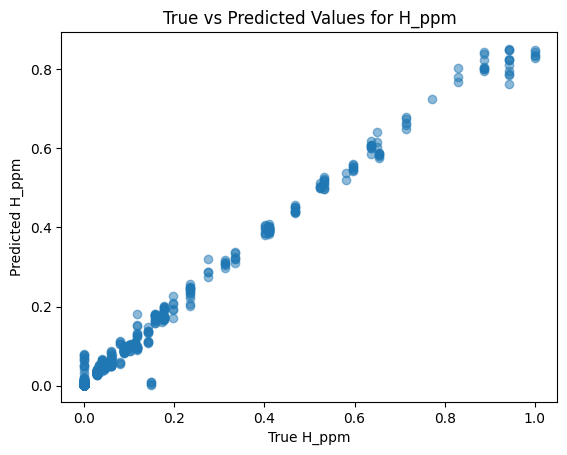
Regression: Predicting Hydrogen Concentration
For the regression task, we developed a deep learning model to predict the concentration of hydrogen in a sample. This required careful design of the model architecture:
- The input layer accepted the normalized features from the dataset.
- Hidden layers incorporated activation functions like ReLU (Rectified Linear Unit) and used dropout to prevent overfitting.
- The output layer produced a single continuous value, representing the predicted hydrogen concentration.
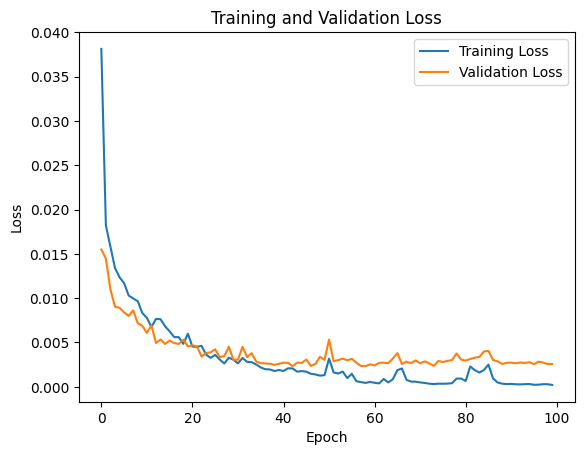
Training the model was an iterative process. We split the dataset into training and validation sets, allowing us to tune hyperparameters such as the learning rate and the number of neurons in each layer. The model’s performance was evaluated using metrics like Mean Squared Error (MSE) and R². By the end of this process, the model demonstrated strong predictive power, accurately estimating hydrogen concentration across diverse samples.
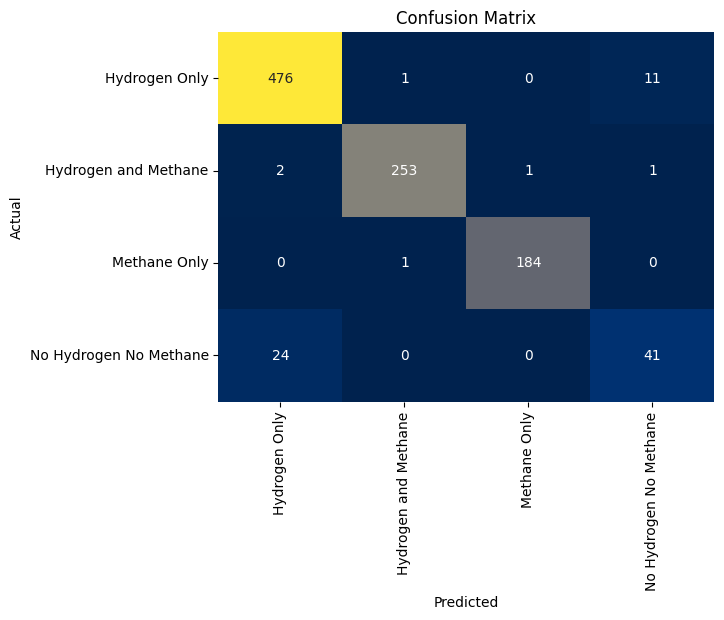
Classification: Identifying Hydrogen Presence
The classification task was equally fascinating. Here, the objective was to determine whether a sample contained hydrogen. To achieve this, we:
- Encoded the target variable as a binary class, representing the presence or absence of hydrogen.
- Built a neural network with softmax activation in the output layer to handle binary classification.
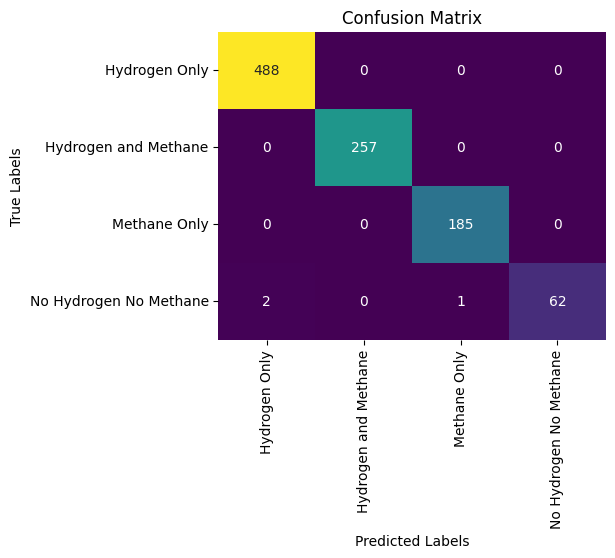
- Evaluated the model using metrics like accuracy, precision, recall, and the F1 score.
The classification model performed exceptionally well, achieving high accuracy in identifying hydrogen-containing samples. The use of confusion matrices provided further insights into the model’s performance, highlighting areas of strength and opportunities for improvement.
Technological and Methodological Insights
Throughout the project, Python was our primary tool, enabling us to seamlessly integrate data analysis and machine learning. Libraries such as Pandas and NumPy facilitated data manipulation, while Matplotlib and Seaborn brought the data to life through visualization. TensorFlow and Keras powered the deep learning models, providing a flexible yet robust framework for building and evaluating neural networks.
The collaborative nature of the project, conducted on Google Colab, ensured real-time sharing of code and results. This setup not only streamlined the workflow but also leveraged cloud-based GPUs, accelerating model training significantly.
Reflections and Achievements
Working on this project under Dr. Salimian’s guidance was a transformative experience. It showcased the power of data science in addressing real-world scientific challenges. From cleaning raw data to building advanced machine learning models, every step reinforced the importance of a structured approach to problem-solving.
Through this project, I gained hands-on experience in data preprocessing, visualization, and deep learning. More importantly, I developed a deeper appreciation for the interplay between data science and domain-specific knowledge. This project stands as a testament to my technical expertise, analytical thinking, and ability to translate complex data into actionable insights. It represents a significant milestone in my journey as a data scientist and researcher.
Lecturer