IoT-enabled Physical Activity Monitoring and Calorie Expenditure Prediction: An End-to-End Edge Analytics Approach for Personalized Health Monitoring


Project Title: IoT-enabled Physical Activity Monitoring and Calorie Expenditure Prediction: An End-to-End Edge Analytics Approach for Personalized Health Monitoring
CSI_7_ICS: INDUSTRIAL CYBER-PHYSICAL SYSTEMS
Overview
Imagine having a personal health assistant that not only tracks your daily activities but also predicts how many calories you’ve burned—all in real-time, right from your wrist! That’s what the IoT-enabled Physical Activity Monitoring and Calorie Expenditure Prediction project is all about. Using Internet of Things (IoT) technology, machine learning, and edge analytics, this project aims to provide personalized, real-time feedback on physical activity and calorie expenditure.
The project combines different technologies, like Node-RED for managing data flows, InfluxDB for storing data, and Grafana for displaying it all in an easy-to-understand way. By predicting calorie burn through machine learning, the system helps users make informed decisions about their activity levels and health—right when they need it.
Why This Matters
We all know that today’s lifestyle often involves sitting for long hours. It’s no wonder that tracking our physical activity and staying healthy can be a challenge. Many health monitoring systems today use centralized cloud-based analytics, which can lead to delays and concerns about privacy. That’s why we created an edge analytics solution—one that processes data locally, so your information stays private and you get feedback faster.
How We Did It
The project involved a series of steps to create this health monitoring solution:
- Dataset
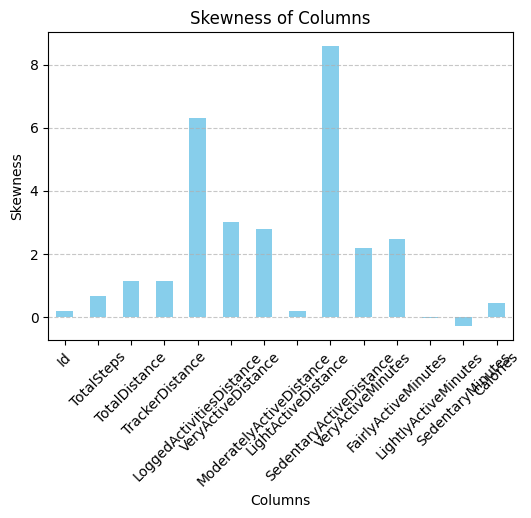
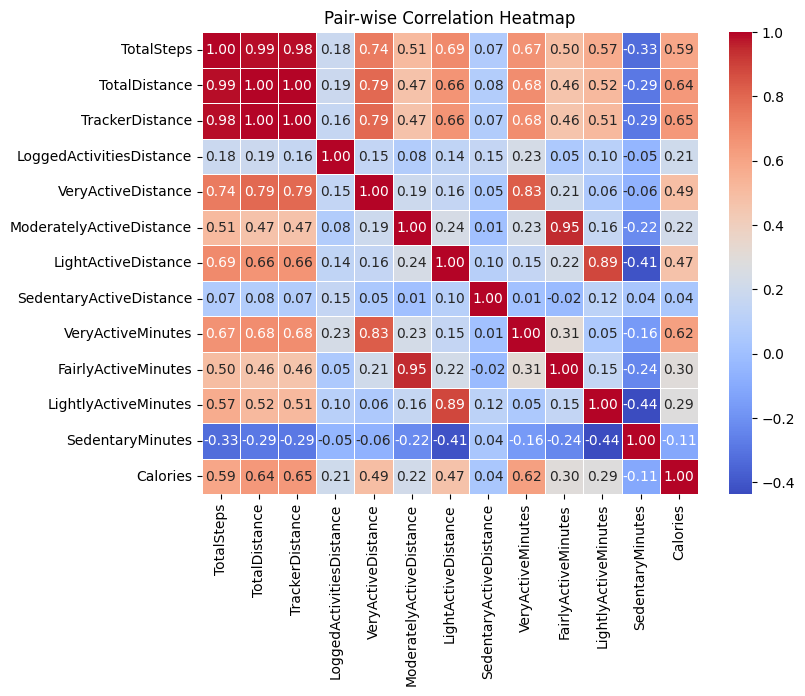
The dataset used came from Fitbit wearable devices. It included data like TotalSteps, TotalDistance, ActiveMinutes, and Calories burned. These features give a full picture of someone’s activity level. We started with Exploratory Data Analysis (EDA) to understand the data, spot outliers, and figure out which features were most important. - Data Pre-processing
Preparing the data is just as important as using it. Here’s how we got our data ready for machine learning:- Export to MATLAB Workspace: We exported the dataset to MATLAB to take advantage of its powerful tools for analysis and modeling.
- Missing Values Check: We checked for missing values and were lucky to find none—meaning we could use the dataset as-is.
- Outlier Detection and Adjustment: We used a moving median method with a threshold of 3 to identify any extreme values. This helped us make sure our model wouldn’t be thrown off by unexpected data points.
- Normalization: We normalized the features using the Z-score method to make sure the data had a mean of 0 and a standard deviation of 1. This helps models perform better because it makes the data more consistent.
- Smoothing Variability: To reduce noise, we applied smoothing techniques using a moving mean method. This made the dataset less erratic and more predictable.
- Data Splitting: Finally, we split the data into training (70%), validation (10%), and testing (20%) sets. The training and validation data were used to develop the models, while the test set was used to evaluate final performance.
- Data Analytics
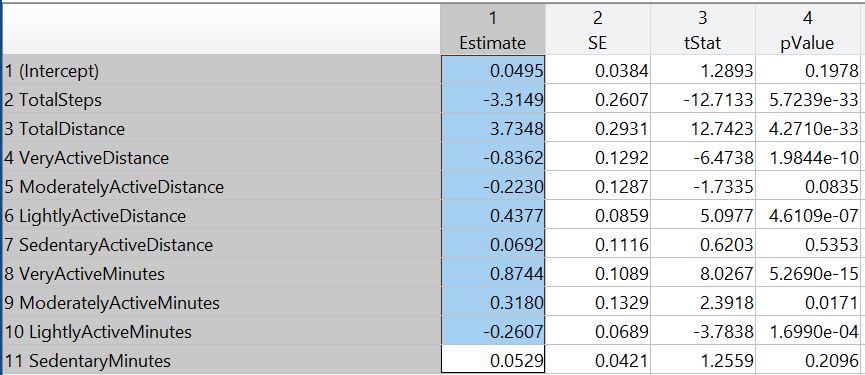
Now for the exciting part—predicting calories! We used MATLAB’s Regression Learner app to train different machine learning models, like Neural Networks, Linear Regression, and Support Vector Machines (SVM):- Model Training: We trained 29 different models using several algorithms to find the best one. We even used techniques like 5-fold cross-validation to make sure our models were as robust as possible.
- Feature Engineering: We initially tested techniques like Principal Component Analysis (PCA), but found they didn’t improve results much, so we skipped them in the final version.
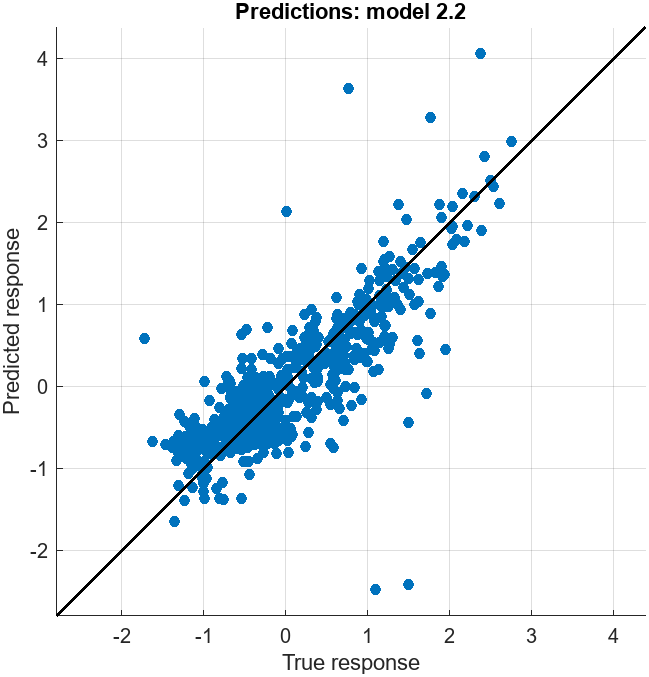
- Evaluation Metrics: We used metrics like Mean Absolute Error (MAE), Root Mean Squared Error (RMSE), and R-squared (R²) to evaluate each model. The Neural Network and Gaussian Process Regression (GPR) models gave us the best performance.
Here’s what those metrics mean:
- R-squared (R²): This tells us how much of the variation in calorie expenditure can be explained by our model:
Where is the sum of squared residuals, and is the total sum of squares.
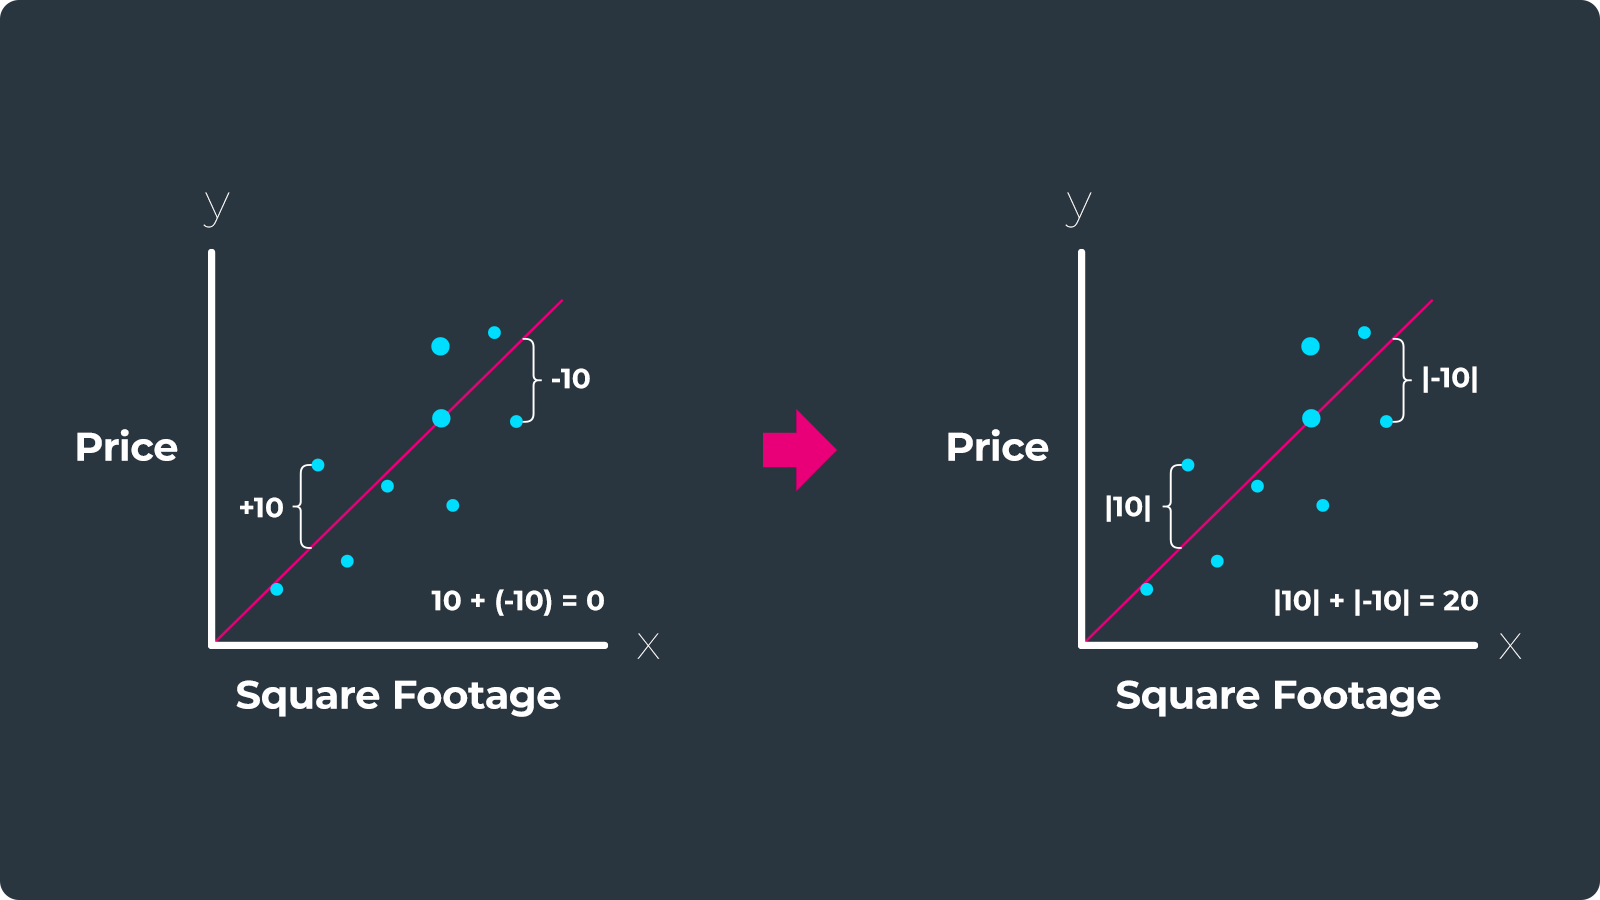
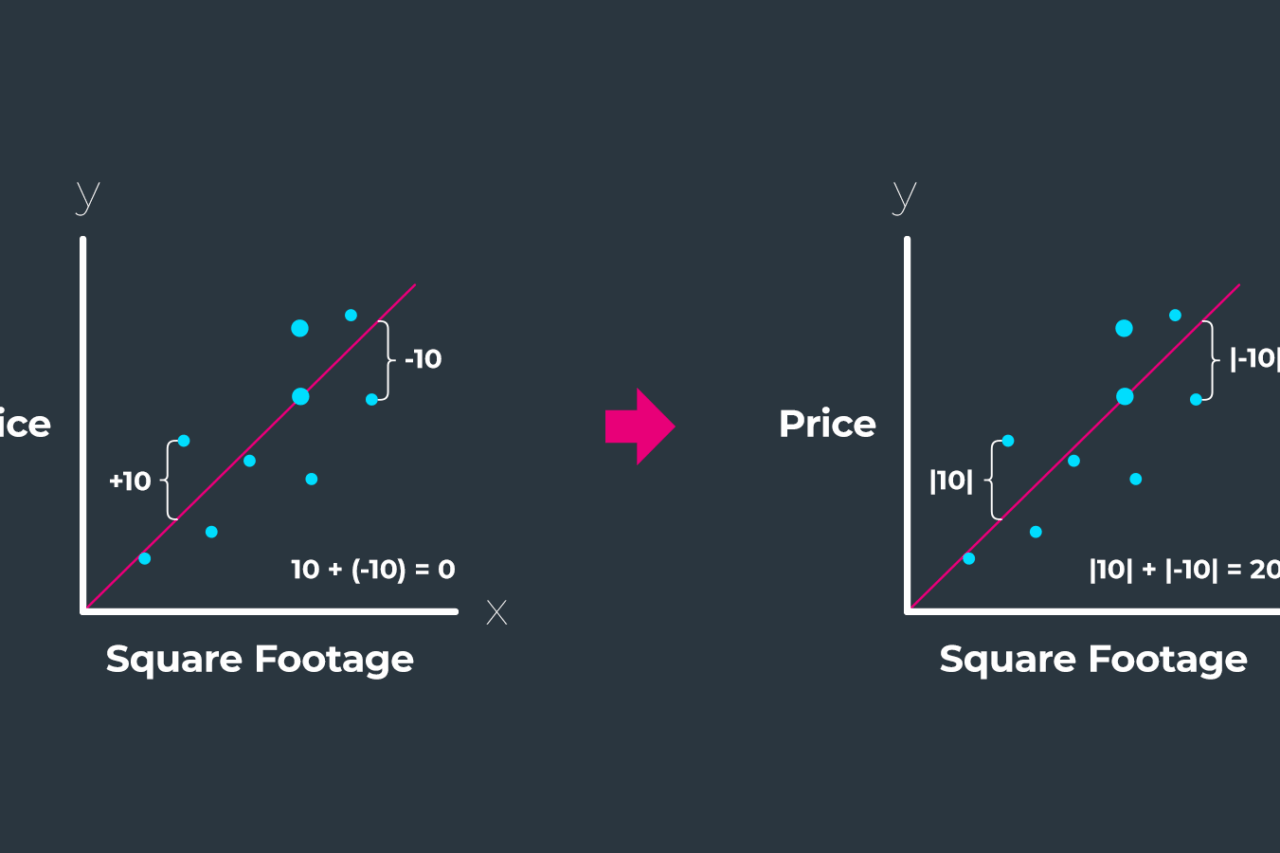
- Mean Absolute Error (MAE): This is the average error in our predictions:
- Root Mean Squared Error (RMSE): This measures how much our predicted values deviate from the actual values:
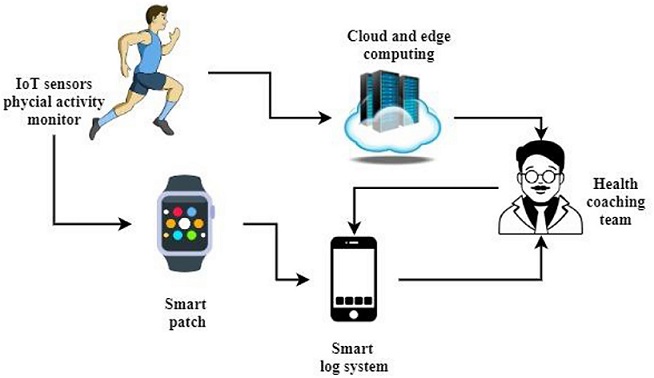
- Gateway Design and Database Integration
We built a data processing gateway using Node-RED and connected it to InfluxDB for data storage:- Node-RED Flow Configuration: In Node-RED, we set up a pipeline to process data locally. This included nodes for injecting data, reading files, editing CSVs, and transforming data in real time.
- Predictive Analytics Integration: We embedded a linear regression model into the Node-RED pipeline to predict calorie expenditure in real-time. The processed data was then stored in InfluxDB, which is perfect for time-series data.
- Dashboard Design
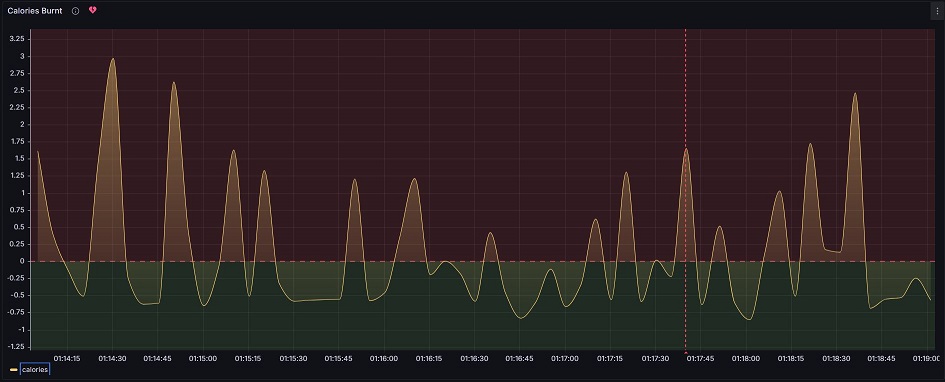
We made the data easy to understand using Grafana to visualize everything:- Visualization Components: Our dashboard shows things like Calories Burned Over Time, Calorie Summary, and gauges for different types of physical activities (like intense and light workouts). This makes it easy for users to track their progress.
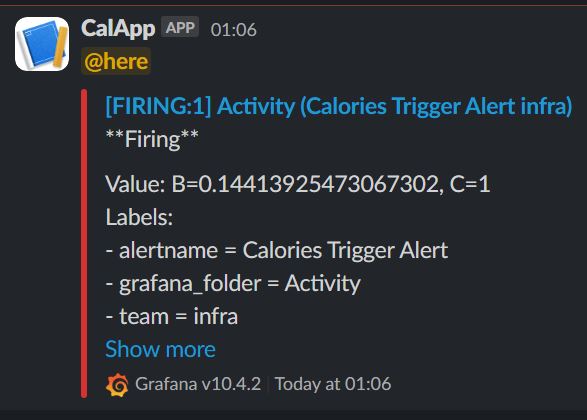
- Alerts and Notifications: We integrated an alert system with Slack to send notifications when activity thresholds were crossed. It’s like having a personal coach nudging you when you’re slacking off!
Key Findings
- Accurate Predictions of Physical Activity: The system does a great job of predicting calorie expenditure based on the user’s activity levels, helping them adjust behaviors accordingly.
- User-Friendly Interface: The Grafana dashboard is easy to navigate and helps users understand their activity patterns, encouraging healthier habits.
Conclusion
This IoT-enabled Physical Activity Monitoring and Calorie Expenditure Prediction project shows how powerful it can be when IoT, edge analytics, and machine learning come together. By giving users real-time, personalized insights, it empowers them to make smarter health choices. Future plans include adding more health metrics, like sleep patterns and diet information, to create an even more complete health monitoring solution.